Question 1: 
Question 2: 
Question 3:
A trader sells an article after two successive discounts of 23% and 24% respectively. If the marked price of the article is Rs.21400, then find its selling price? (in Rs.)
एक व्यापारी क्रमश: 23% और 24% की दो क्रमिक छूट के बाद एक वस्तु बेचता है। यदि वस्तु का अंकित मूल्य Rs.21400 है, तो इसका विक्रय मूल्य ज्ञात कीजिए ? (Rs. में)
Question 4:
What is the difference between the compound interests on Rs.24000 for 1 year at 8% per annum, compounding the interest annually and half yearly? (in Rs.)
ब्याज की गणना वार्षिक और अर्धवार्षिक चक्रवृद्धि आधार पर करते हुए, 8% प्रति वर्ष की दर से 1 वर्ष के लिए Rs.24000 पर चक्रवृद्धि ब्याजों के बीच क्या अंतर है ? (Rs. में)
Question 5:
Point M is the circumcentre of the circumcircle of △ABC of radius 15 cm. Let BC = 24 cm and ML is perpendicular to BC, then what will be the length of ML?
बिन्दु M, 15 cm परित्रिज्या (circumradius) वाले, किसी △ABC के परिवृत्त का परिकेन्द्र है। मान लें कि BC = 24 cm तथा ML, BC पर लंब है, तो ML की लंबाई क्या होगी ?
Question 6:
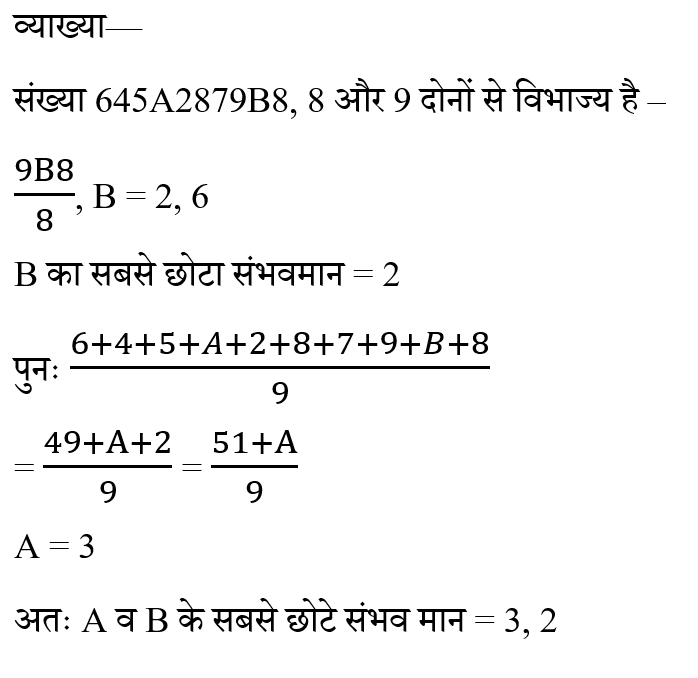
If the number 645A2879B8 is divisible by both 8 and 9, then the smallest possible values of A and B will be _______.
यदि संख्या 645A2879B8, 8 और 9 दोनों से विभाज्य है, तो A और B के सबसे छोटे संभव मान,_______ होंगे।
Question 7:
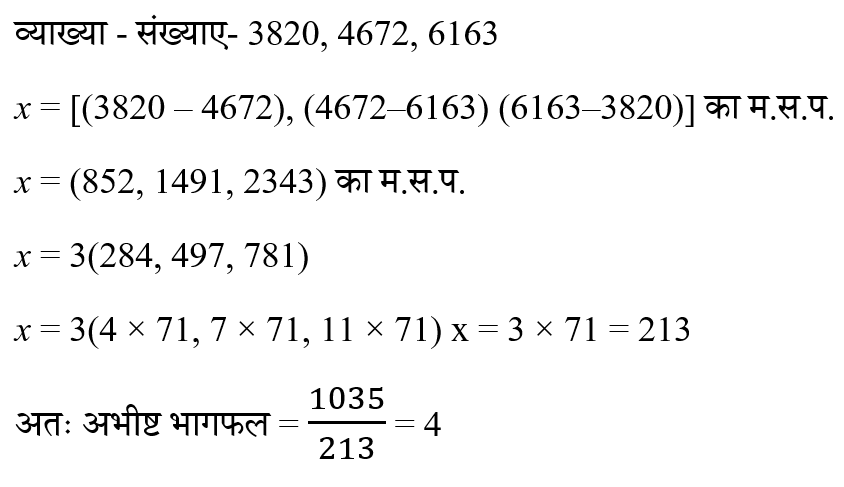
When 3820, 4672 and 6163 are divided by the greatest number x, the remainder in each case is the same. Find the quotient obtained when 1035 is divided by x.
जब 3820, 4672 और 6163 को बड़ी से बड़ी संख्या x से विभाजित किया जाता है, तो प्रत्येक स्थिति में प्राप्त शेषफल समान होता है। जब 1035 को x से विभाजित किया जाता है, तो प्राप्त भागफल ज्ञात करें।
Question 8:
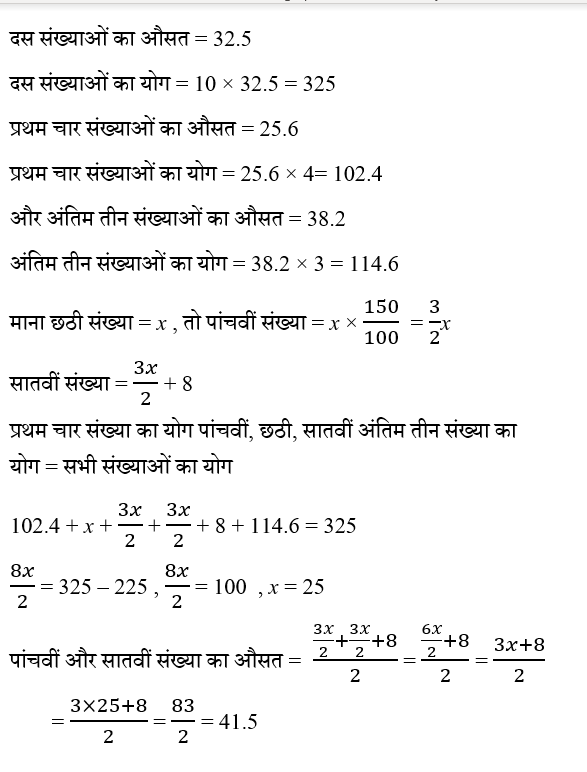
The average of ten numbers is 32.5. The average of the first four numbers is 25.6 and the average of the last three numbers is 38.2. The fifth number is 50% more than the sixth number and 8 less than the seventh number. Find the average of fifth and seventh number.
दस संख्याओं का औसत 32.5 है। पहली चार संख्याओं का औसत 25.6 है और अंतिम तीन संख्याओं का औसत 38.2 है। पांचवीं संख्या, छठी संख्या से 50% अधिक है और सातवीं संख्या से 8 कम है। पांचवीं और सातवीं संख्या का औसत ज्ञात करें।
Question 9:
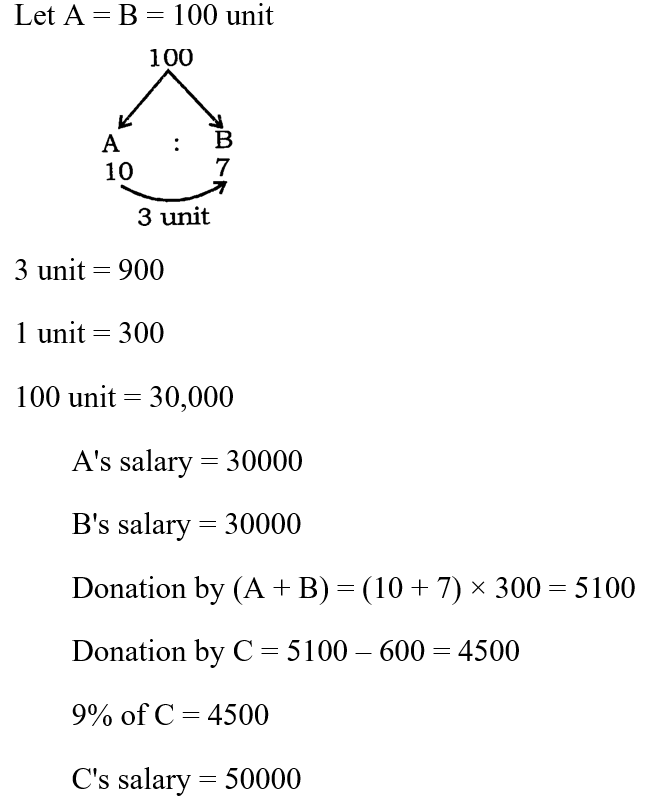
Three persons A, B and C donate 10%, 7% and 9% respectively of their monthly salaries to a charitable trust. Monthly salaries of A and B are equal and the difference between the donations of A and B is ₹900. If the total donation by A and B is ₹600 more than that of C, then what is the monthly salaryof C? ( in ₹)
तीन व्यक्ति A, B और C अपने मासिक वेतन का क्रमशः 10%, 7% और 9% भाग एक धमार्थ ट्रस्ट को दान करते हैं। A और B का मासिक वेतन बराबर है और A और B के दान के बीच अंतर ₹900 है। यदि C की तुलना में A और B द्वारा किया गया कुल दान ₹600 अधिक है, तो C का मासिक वेतन ( ₹ में) ज्ञात करें।
Question 10:
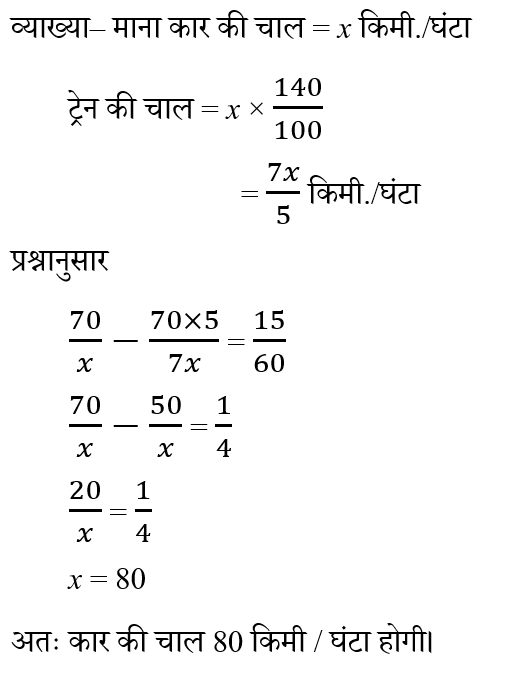
A train can travel 40% faster than a car. Both train and car start from point A at the same time and reach point B at the same time, which is 70 km away from point A. However, on the way, the train had lost about 15 minutes due to stoppages at stations. What is the speed of the car in km/h?
एक ट्रेन एक कार की तुलना में 40% अधिक तेजी से यात्रा कर सकती है। ट्रेन और कार दोनों एक ही समय में बिंदु A से चलना शुरू करती हैं और बिंदु B तक एक ही समय पर पहुंचती हैं, जो कि बिंदु A से 70 किमी दूर है। हालांकि, रास्ते में, स्टेशनों पर रुकने के चलते ट्रेन ने लगभग 15 मिनट गवां दिए थे। कार की चाल किमी / घंटा में कितनी है ?


