Question 1:
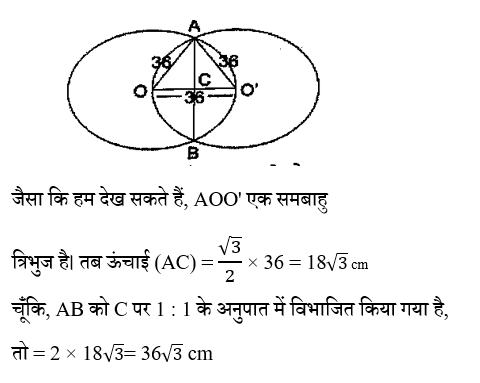
दो वृत्त जिनमे से प्रत्येक की त्रिज्या 36 सेमी है एक दूसरे को इस प्रकार प्रतिच्छेद कर रहे हैं कि प्रत्येक वृत्त दूसरे वृत्त के केंद्र से होकर गुजर रहा है। दो वृत्तों की उभयनिष्ठ जीवा की लंबाई (cm) कितनी है?
Two circles, each of radius 36 cm, intersect each other such that each circle passes through the center of the other circle. What is the length (cm) of the common chord of two circles?
Question 2:
Question 3:
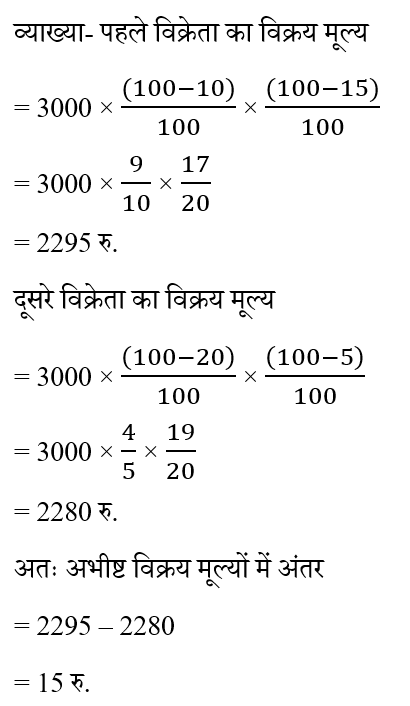
Two sellers sell an article for Rs.3000. sold at the same marked price. The first seller gives successive discounts of 10% and 15%. Another seller gives successive discounts of 20% and 5%. Find the difference in the selling price of the article under both the discounts.
दो विक्रेता किसी वस्तु को 3000 रु. के समान अंकित मूल्य पर बेचते हैं। पहला विक्रेता 10% और 15% की क्रमागत छूट देता है। दूसरा विक्रेता 20% और 5% की क्रमागत छूट देता है। दोनों छूटों के अंतर्गत वस्तु के विक्रय मूल्य में अंतर ज्ञात करें।
Question 4:
A train covers a distance of 450 km at a uniform speed. the speed of the train had been 5 km/hr more, it would have taken 1 hour less to cover the same distance. In how much time will the train cover a distance of 315 km moving at its normal speed?
कोई रेलगाड़ी, एक समान चाल से 450 किमी. की दूरी तय करती है। यदि रेलगाड़ी की चाल 5 किमी / घंटा अधिक होती, तो उसे समान दूरी को तय करने में 1 घंटा कम समय लगता । अपनी सामान्य चाल से चलते हुए रेलगाड़ी कितने समय में 315 किमी. की दूरी तय करेगी ?
Question 5: 
Question 6:
P and Q are two cities. A man travels from P to Q at an average speed of 50 km/hr. He stops at Q for 4 hours and then goes back to P traveling on the same route at an average speed of 40 km/hr. If he takes 22 hours for the entire journey, find his average speed (in km/hr, rounded to two places after the decimal).
P और Q दो शहर हैं। कोई आदमी 50 किमी / घंटा की औसत चाल से P से Q तक यात्रा करता है। वह 4 घंटे के लिए Q पर रुकता है और फिर उसी मार्ग पर 40 किमी / घंटा की औसत चाल से चलते हुए P पर वापस जाता है। यदि उसे पूरी यात्रा में 22 घंटे लगते हैं, तो उसकी औसत चाल (किमी / घंटा में, दशमलव के बाद दो स्थानों तक) ज्ञात करें।
Question 7:
At the rate of simple interest of 4% per annum, in 1.5 years, a certain sum would be equal to Rs 9243.20. What will be the simple interest on the same amount at 8% per annum for 7½ years?
प्रति वर्ष 4% के साधारण ब्याज की दर से, 1.5 वर्षों में, एक निश्चित राशि 9243.20 रु. के बराबर होता। 7½ वर्ष के लिए समान राशि पर 8% प्रति वार्षिक दर से साधारण ब्याज क्या होगा ?
Question 8:
One side of a rhombus is 13 cm and one of its diagonals is 10 cm. Find the area (in cm2) of the rhombus.
किसी समचतुर्भुज की एक भुजा 13 सेमी. है और इसका एक विकर्ण 10 सेमी. है। समचतुर्भुज का क्षेत्रफल (सेमी2 में) ज्ञात करें।
Question 9:
The given bar graph shows the production (in lakh tonnes) of sugar by three different sugar companies P, Q and R from the year 2015 to 2019. Study the bar graph and then answer the given question. Production of sugar by companies P, Q and R from 2015 to 2019.
दिया गया बार ग्राफ वर्ष 2015 से 2019 तक P, Q और R तीन विभिन्न चीनी कंपनियों द्वारा चीनी के उत्पादन ( लाख टन में ) को दर्शाता है। बार ग्राफ का अध्ययन करें और उसके बाद दिए गए प्रश्न का उत्तर दें। P, Q और R कंपनियों द्वारा 2015 से 2019 तक किया जाने वाला चीनी का उत्पादन।
Find the ratio of the average production of sugar by company P from 2015 to 2019 to the average production of sugar by company R from 2015 to 2019.
कंपनी P द्वारा वर्ष 2015 से 2019 तक किए जाने वाले चीनी के औसत उत्पादन का कंपनी R द्वारा वर्ष 2015 से 2019 तक " किए जाने वाले चीनी के औसत उत्पादन से अनुपात ज्ञात करें।

Question 10:
A shopkeeper bought 60 pencils at the rate of 4 for Rs 5 and another 60 pencils at the rate of 2 for Rs 3. He mixed all the pencils and sold them at the rate of 3 for Rs 4. Find his profit or loss percentage.
एक दुकानदार ने 60 पेंसिलें 5 रु. में 4 की दर से तथा अन्य 60 पेंसिलें 3 रु. में 2 की दर से खरीदीं। उसने सभी पेंसिलों को मिला दिया और उन्हें 4 रु. में 3 की दर से बेच दिया। उसका लाभ या हानि प्रतिशत ज्ञात कीजिए।


